Reports & analytics

Your shop's numbers, read at a glance

Reports turns your live data into one scrollable dashboard — revenue and completed-job totals, quote conversion, and a Profit Leak Detector that ranks what's costing you money right now. Nothing to generate or export; every visit recalculates from your current data.

wraptor.io/reports
Wraptor Reports dashboard showing KPI tiles, the Profit Leak Detector, revenue charts, and top customers

The problem

You can't fix what you can't see

Without real numbers, pricing and follow-up decisions are guesswork — and money leaks out quietly between jobs.

Without Wraptor

  • No clear read on revenue or whether it's trending up
  • Unpaid invoices and aging quotes slipping out of sight
  • Thin-margin jobs that look fine until you add it up
  • No idea which customers are actually worth the most
  • Pulling numbers by hand into a spreadsheet each month

With Wraptor

  • Four headline KPIs: revenue, completed jobs, conversion, stale quotes
  • A Profit Leak Detector ranking your biggest issues by dollars at stake
  • Revenue-vs-material-cost and throughput charts over 12 months
  • A quote funnel and average-time-per-stage to spot where deals stall
  • A ranked top-customers list for smarter repeat outreach

How it works

From setup to done.

01

Read the headline KPIs

Open Reports and scan four tiles: total revenue and jobs completed over 12 months, quote conversion, and a stale-quote count that turns red when any need follow-up.

02

Work the Profit Leak Detector top-down

Up to five ranked cards show what's costing you money — overdue invoices first, then low-margin jobs, aging quotes, material-heavy jobs, untracked labor, and stuck jobs. Click a card to jump to the exact fix.

03

Spot trends and pipeline drag

Watch revenue and material cost move together month over month, see throughput rise or fall, and use the quote funnel and average-time-per-stage to find where work bogs down.

Capabilities

Everything in the box.

Headline KPIs

Four tiles tell the story: total revenue (last 12 months), jobs completed (12 months), quote conversion with an X/Y-approved breakdown, and a stale-quote count that flips to red when any need follow-up.

Profit Leak Detector

The standout feature. A ranked, color-coded list of up to five things costing you money right now — unpaid invoices, low-margin jobs, aging quotes, material-heavy jobs, untracked labor, and stuck jobs. Each card links straight to where you'd fix it.

Revenue vs. material cost

A 12-month area chart that plots revenue against material cost so you can see margin pressure building over time, not just in a single bad month.

Quote funnel & throughput

See how many quotes flow from Draft to Sent to Approved to Converted, alongside a jobs-completed-per-month chart that shows whether your throughput is rising or falling.

Average time per stage

How long jobs typically sit in each workflow stage, so you can see where production bogs down. It needs job history to fill in, so a brand-new shop sees it build up over time.

Top customers & stale quotes

A ranked list of your highest-revenue accounts with job counts for smarter repeat outreach, plus an amber panel surfacing quotes sent 14+ days ago with no response so you chase the right ones.

FAQ

Common questions.

What does the Reports screen show?

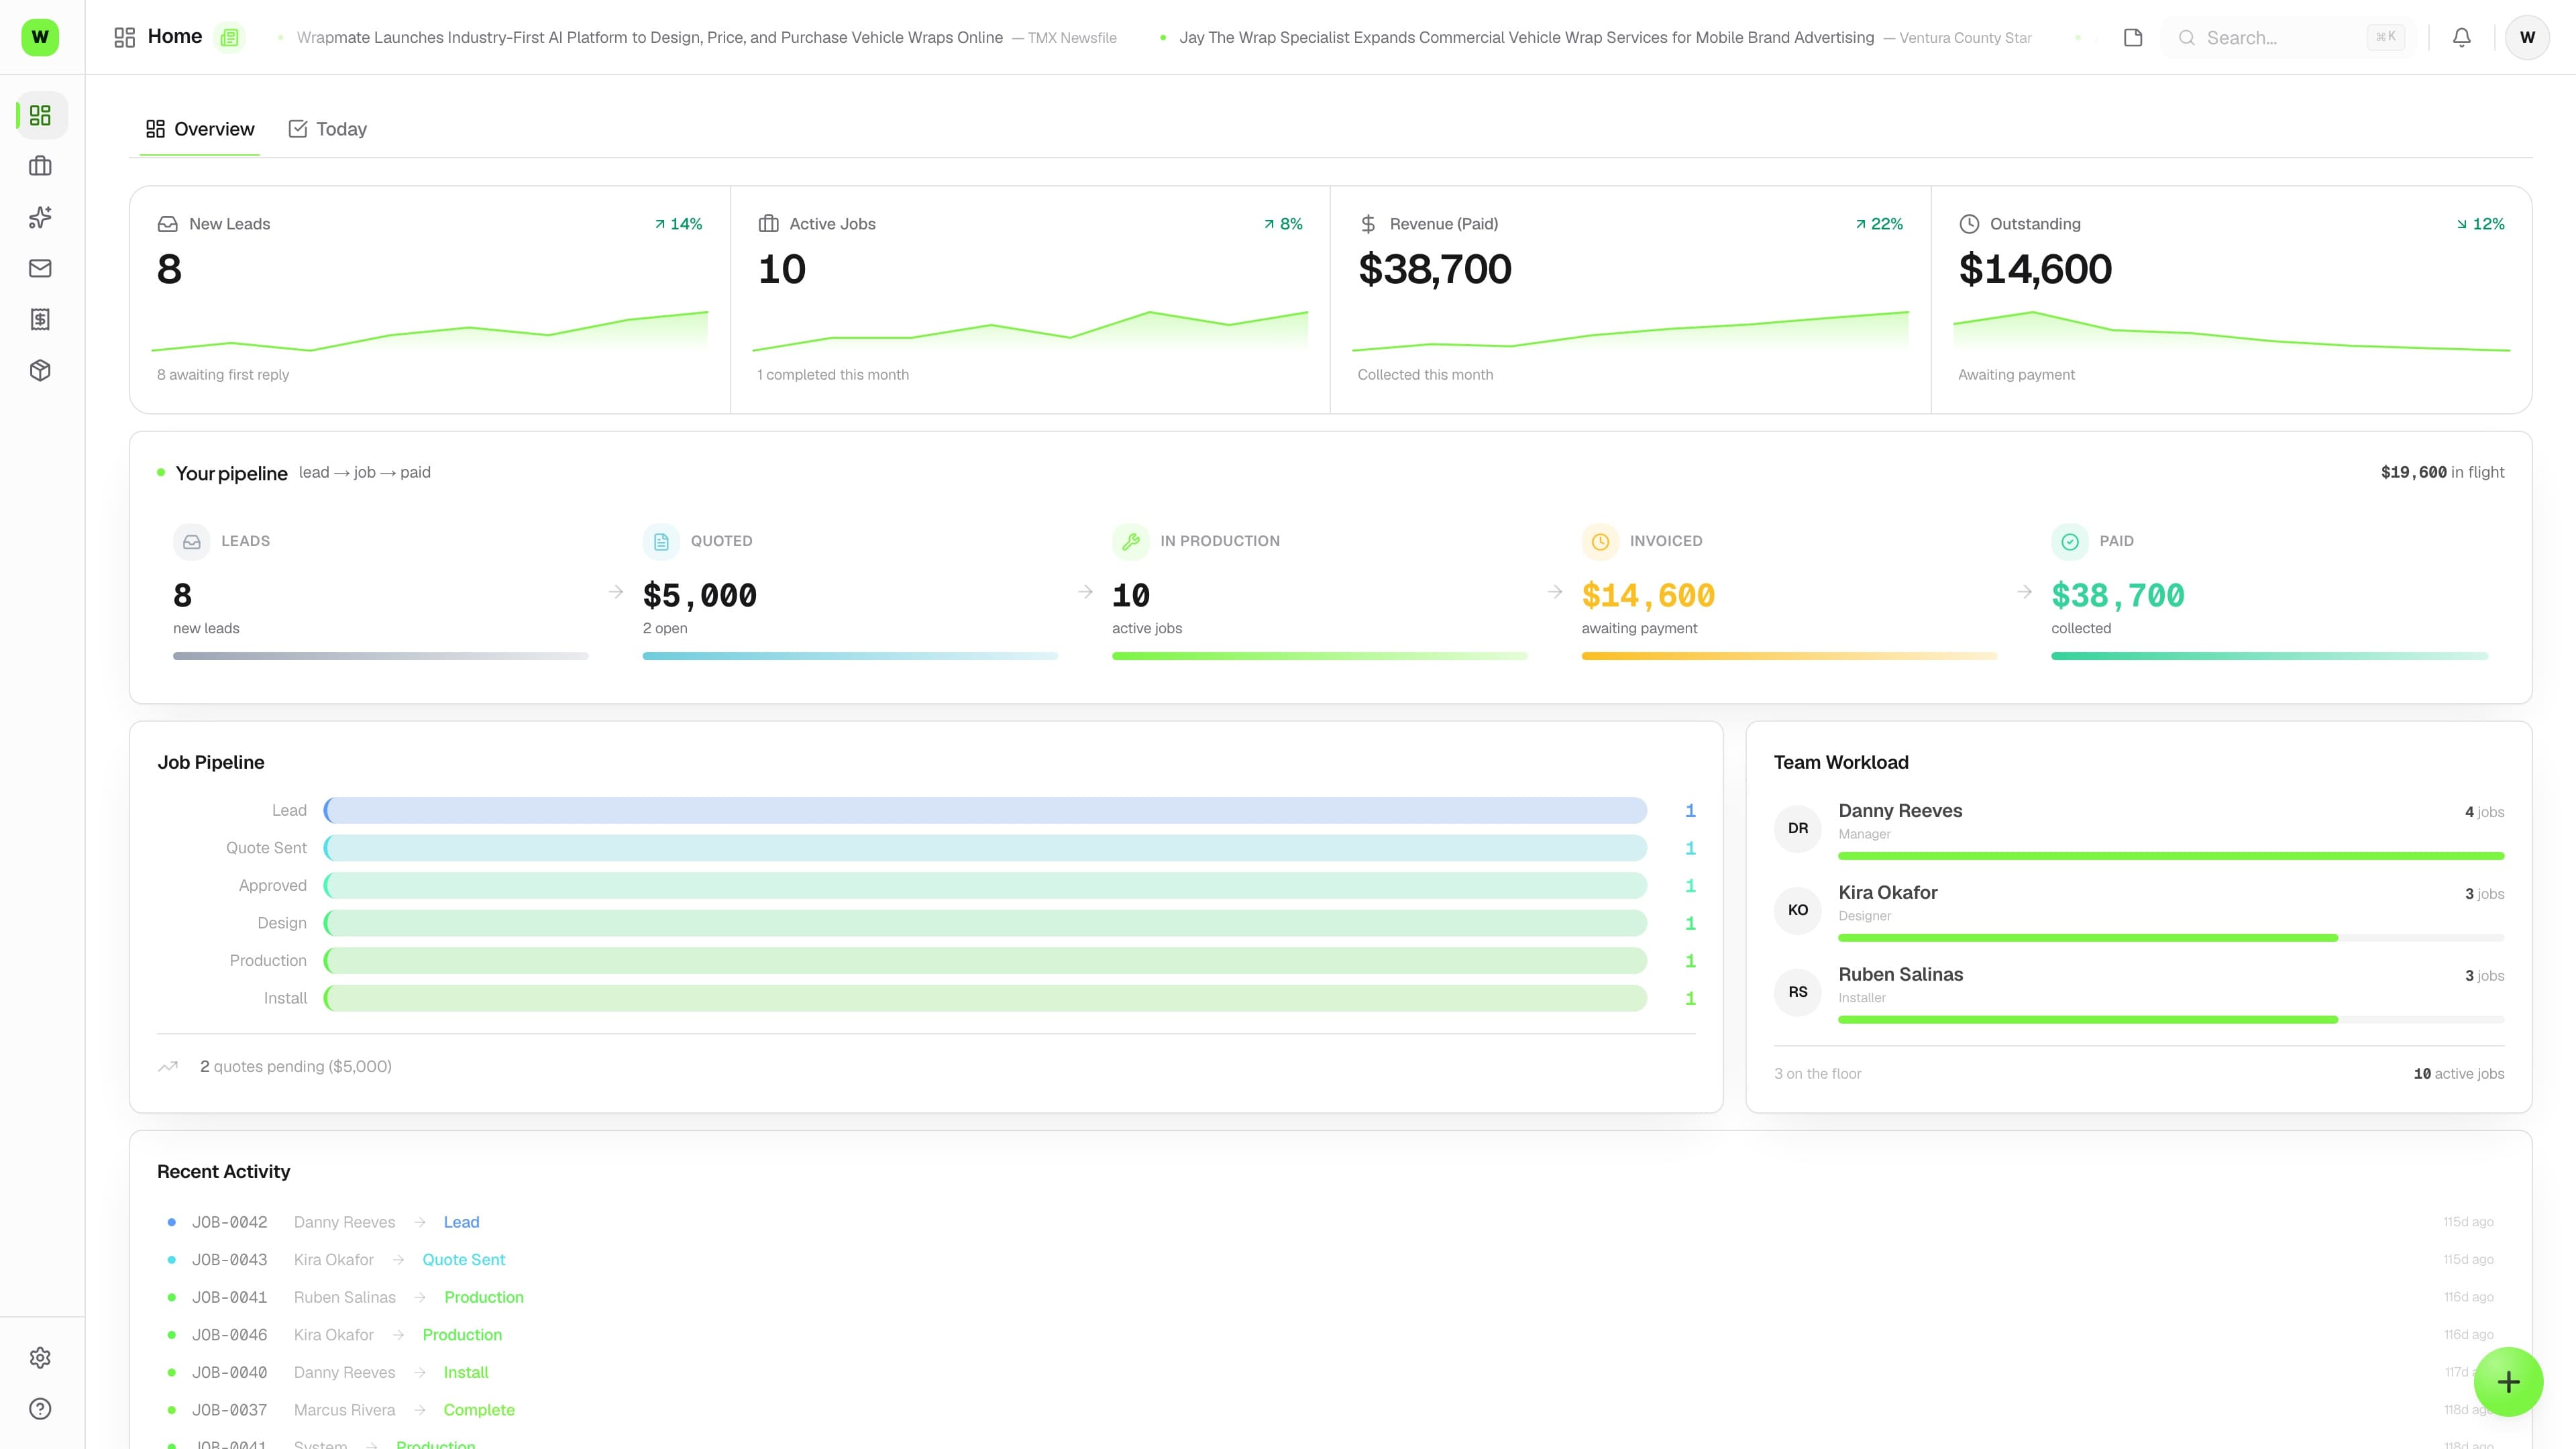
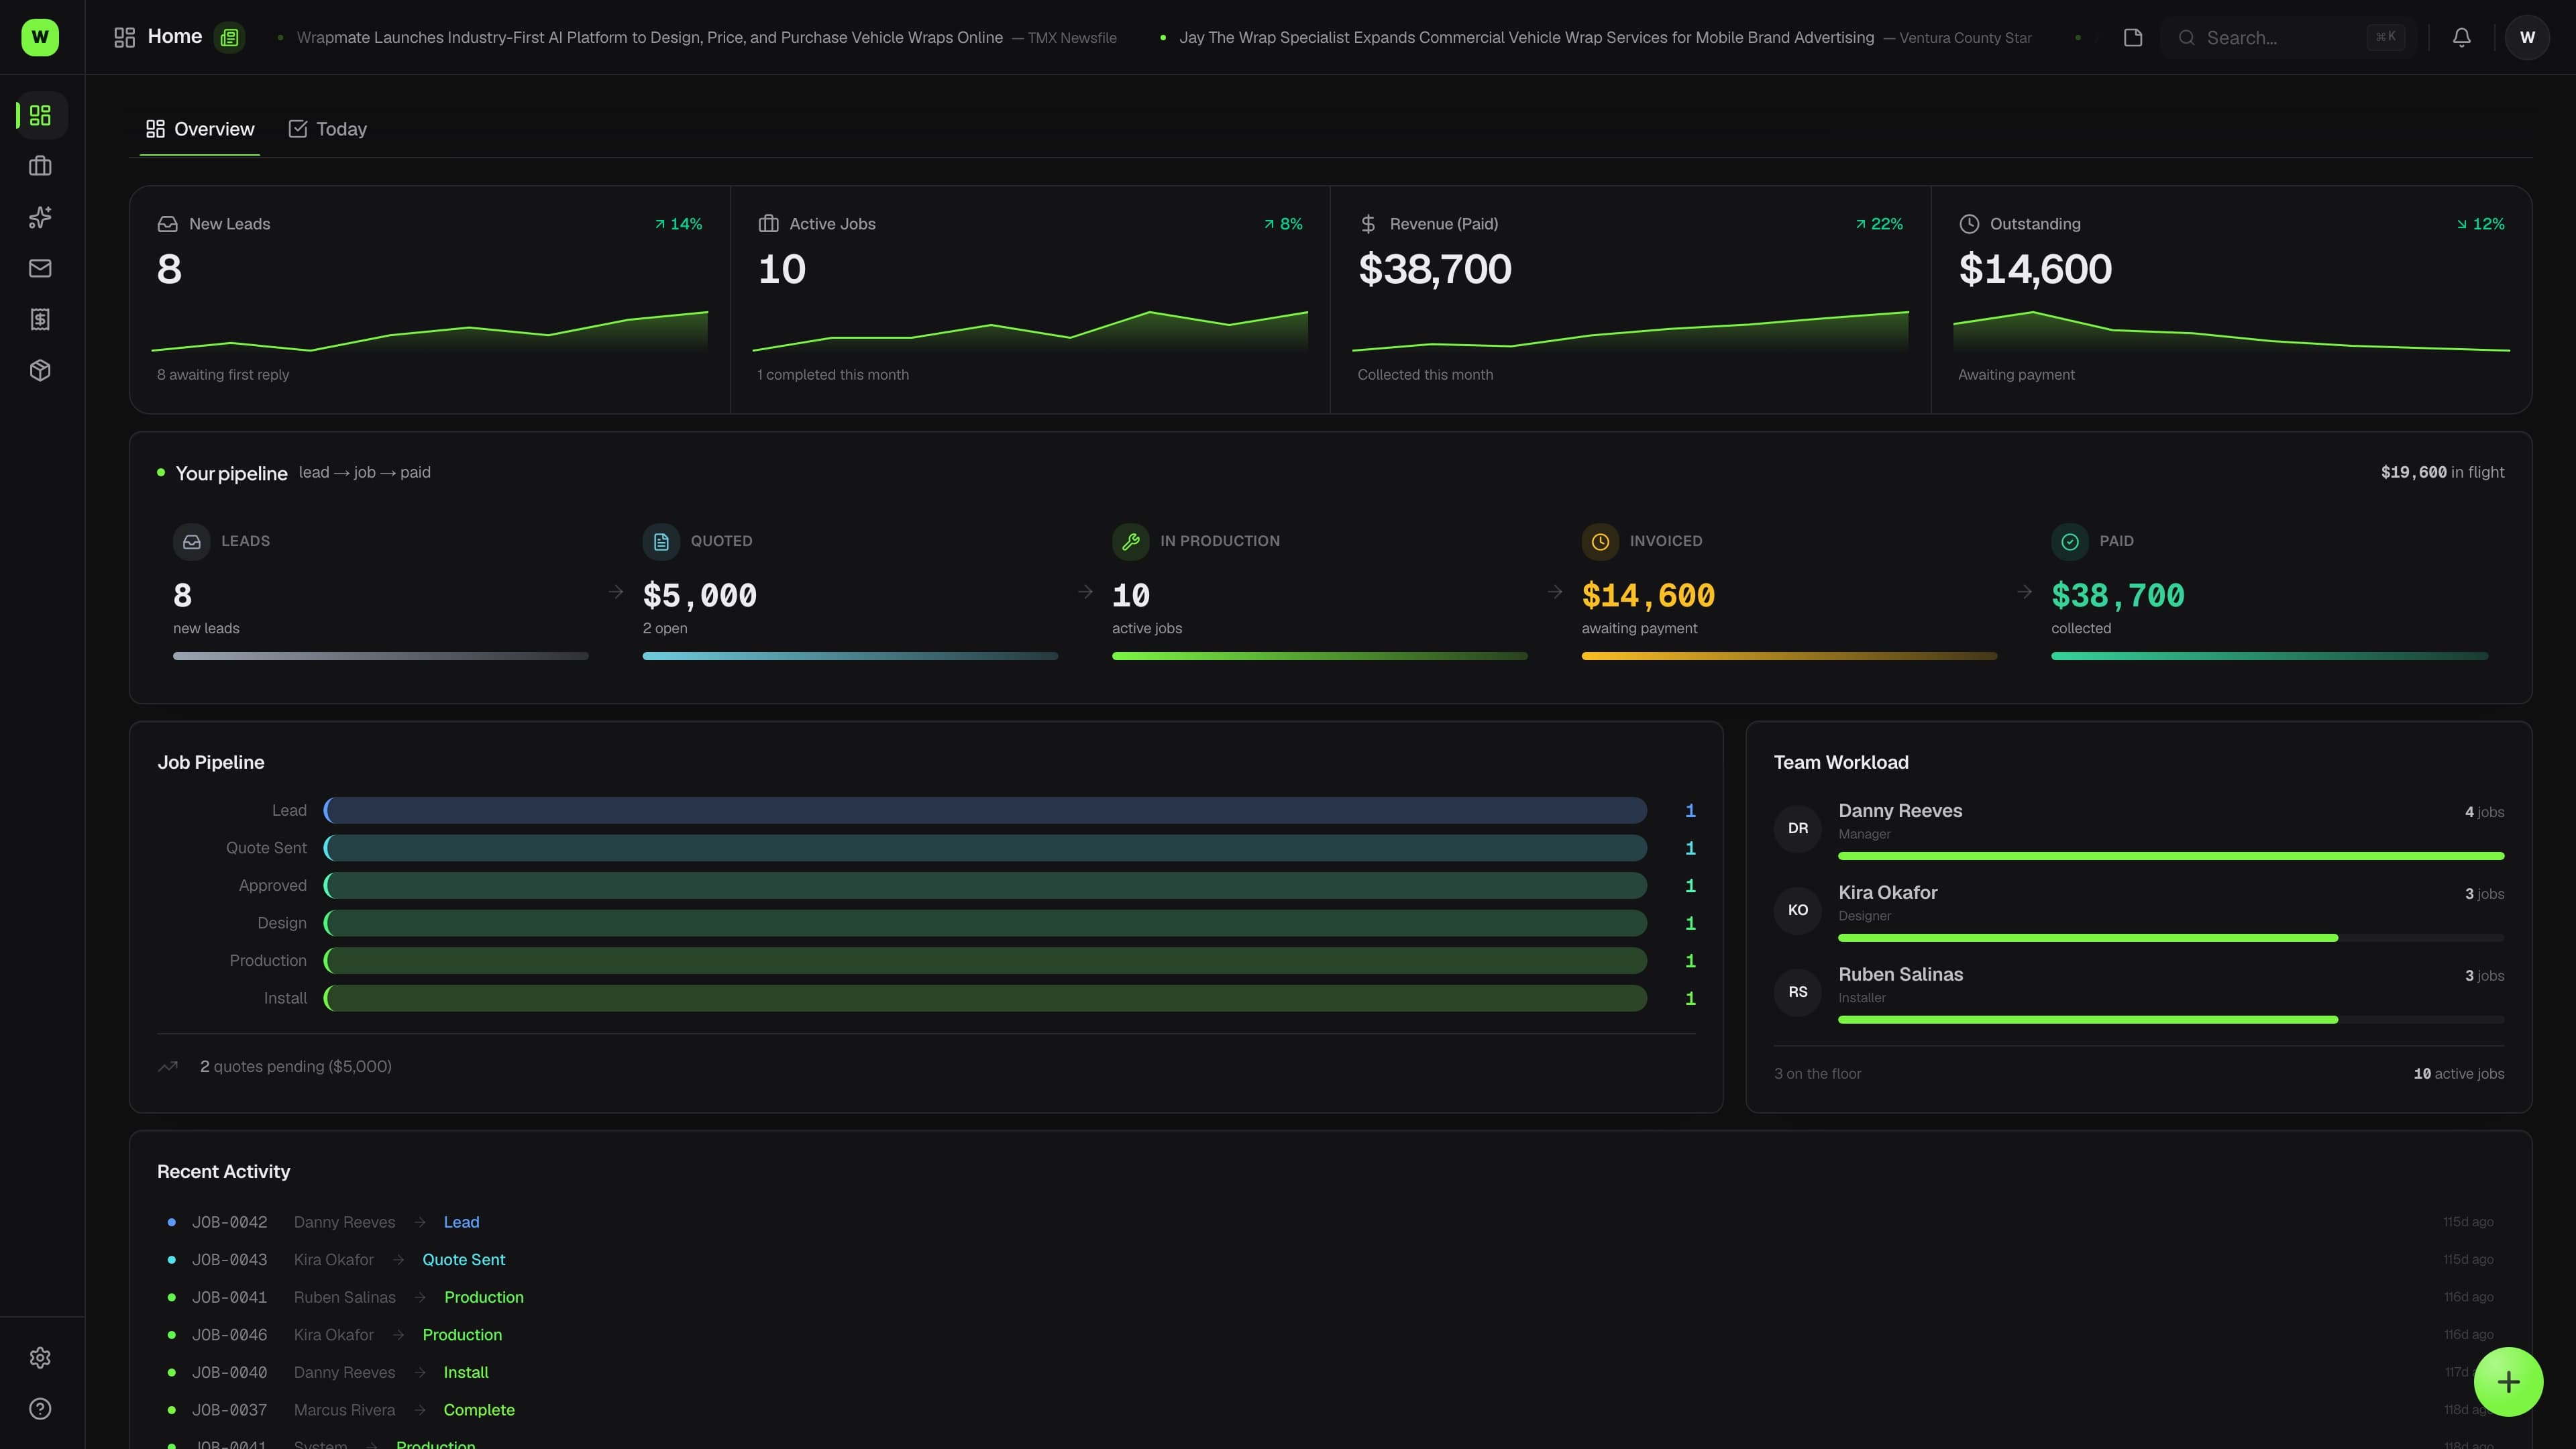
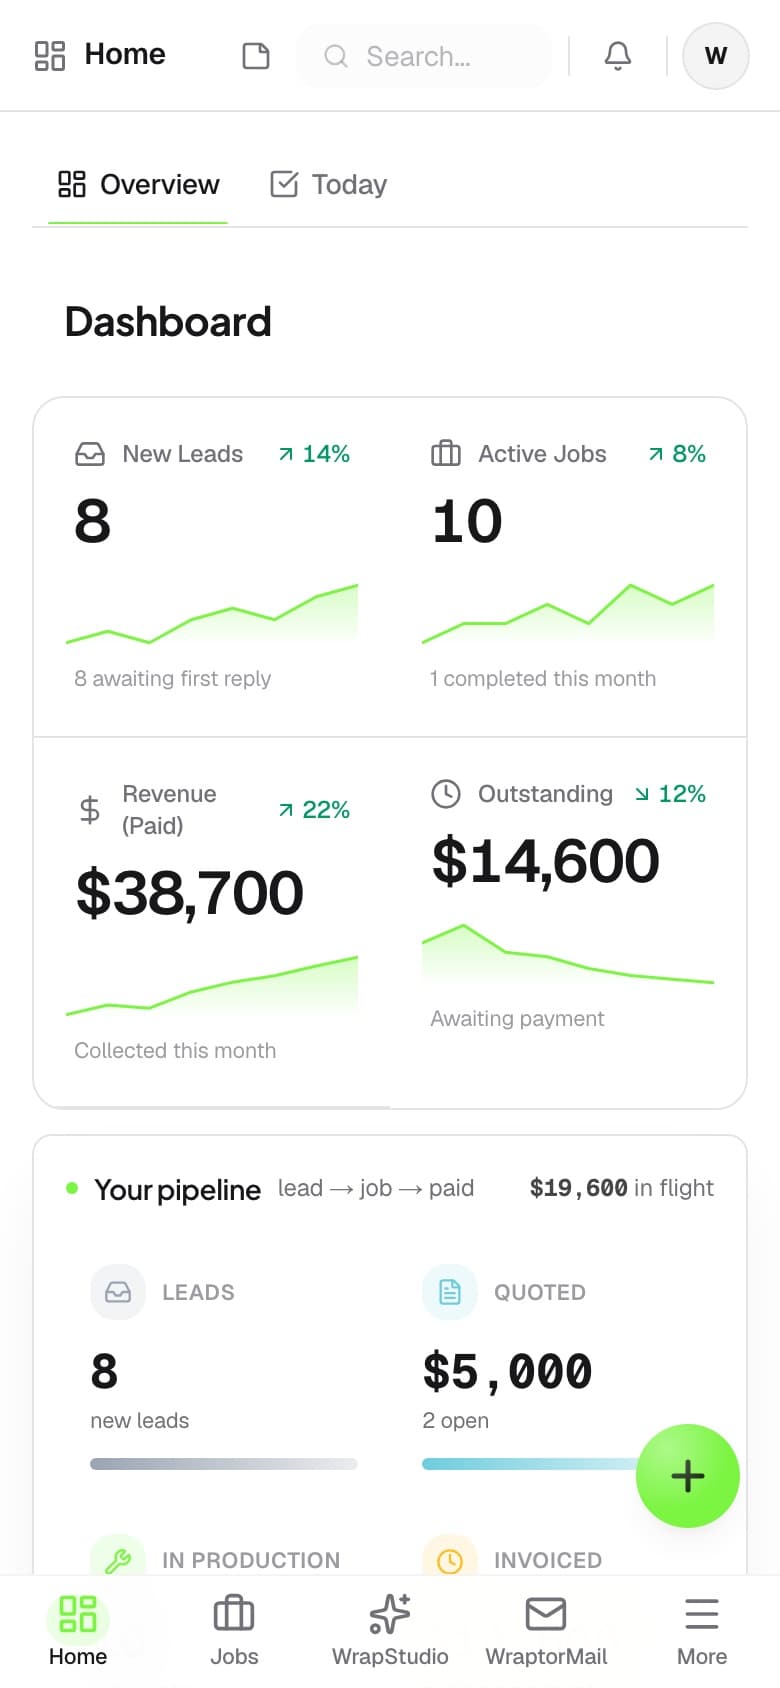
Reports is a single live dashboard with four headline KPIs (revenue and jobs completed over 12 months, quote conversion, and stale quotes), a Profit Leak Detector, revenue-vs-material-cost and throughput charts, a quote funnel, average time per stage, and a ranked top-customers list. It's read-only and recalculates from your current data on every visit.

What is the Profit Leak Detector?

The Profit Leak Detector is a ranked, color-coded list of up to five things costing your shop money right now — overdue invoices first, then low-margin jobs, aging quotes, material-heavy jobs, jobs missing logged labor, and jobs stuck in a stage. Each card shows a dollar or days figure and links straight to where you'd fix it.

Does revenue in Reports mean invoiced or collected?

Every revenue figure counts money actually collected, not money invoiced. A big invoice that hasn't been paid shows up as an unpaid-invoices leak rather than as revenue — that's by design, so the numbers reflect cash in hand.

Who can see Reports, and does it cost extra?

Reports is gated by the Reports permission, which belongs to the Manager role by default; a manager can grant it to a custom role like a bookkeeper. It has no plan gate and uses no AI credits, so it works on every plan for anyone with the permission. Per-job profitability still appears on an individual job's page for other roles.

Stop guessing where the money goes

Reports is included on every plan — no AI credits, nothing to generate. Open it any day for a live read on revenue, margins, and the leaks worth fixing.

Try Wraptor