Dashboard
Your whole shop, in one ten-second read
The Dashboard is the manager's home screen — a live pulse monitor that pulls jobs, quotes, invoices, your team, and your ink into one view. See what's in progress, what's coming in, who's busy, and what needs attention, then click straight into it.

The problem
Where does the day actually stand?
Answering that means opening five screens. The Dashboard pulls the whole shop into one snapshot you can read before your coffee's done.
Without Wraptor
- No single screen that shows how the shop is doing right now
- Bottlenecks in a stage you don't notice until it's a problem
- No quick read on who's overloaded and who has room
- Outstanding balances easy to lose track of day to day
- Running low on ink and finding out mid-print
With Wraptor
- Four KPIs: active jobs, completed this month, revenue paid, and outstanding
- A Job Pipeline bar per stage so you see where work piles up
- A Quote Pipeline showing pending and approved value
- Team Workload ranking who's carrying the most active jobs
- Low-ink alerts and a recent-activity feed that links to each job
How it works
From setup to done.
Do your morning check-in
Open the Dashboard and scan the four KPIs, then the Job and Quote pipelines, to get the headline story of the shop in seconds — no refresh button, every visit re-reads the latest numbers.
Balance the team and catch problems
Check Team Workload to see who's loaded up before someone's buried, and glance for a Low Ink card — it only appears when a printer needs attention, with a one-click reorder link.
Jump straight into the work
Every line in Recent Activity links to the job that moved, so the Dashboard doubles as a launchpad: spot what matters, click through, and act.
Capabilities
Everything in the box.
Headline KPIs
Four numbers tell the right-now story: Active Jobs, Completed This Month, Revenue (Paid), and Outstanding with an on-hold note. Revenue counts money actually collected, not quoted or invoiced.
Job & Quote pipelines
A bar for each workflow stage shows where jobs are piling up, while the Quote Pipeline shows how many quotes are pending and approved and their dollar value — so you see committed and potential work at once.
Team Workload
A ranked view of who's carrying how many active jobs, so you can redistribute work before anyone gets buried. The names come straight from your team and assignments.
Low Ink alerts
A Low Ink card appears only when a printer drops below its threshold, with quick reorder links. No card means every channel is above its threshold — thresholds and printers are set in Inventory.
Recent Activity feed
The latest job movements, each a clickable line that jumps straight to that job. The Dashboard isn't just a readout — it's the fastest launchpad into the work that just changed.
Setup checklist
While your shop is new, a dismissible card nudges you to set your brand color, add materials, complete shop details, invite your team, and create a first quote. Each item links to the exact screen, and it vanishes once everything's done.
FAQ
Common questions.
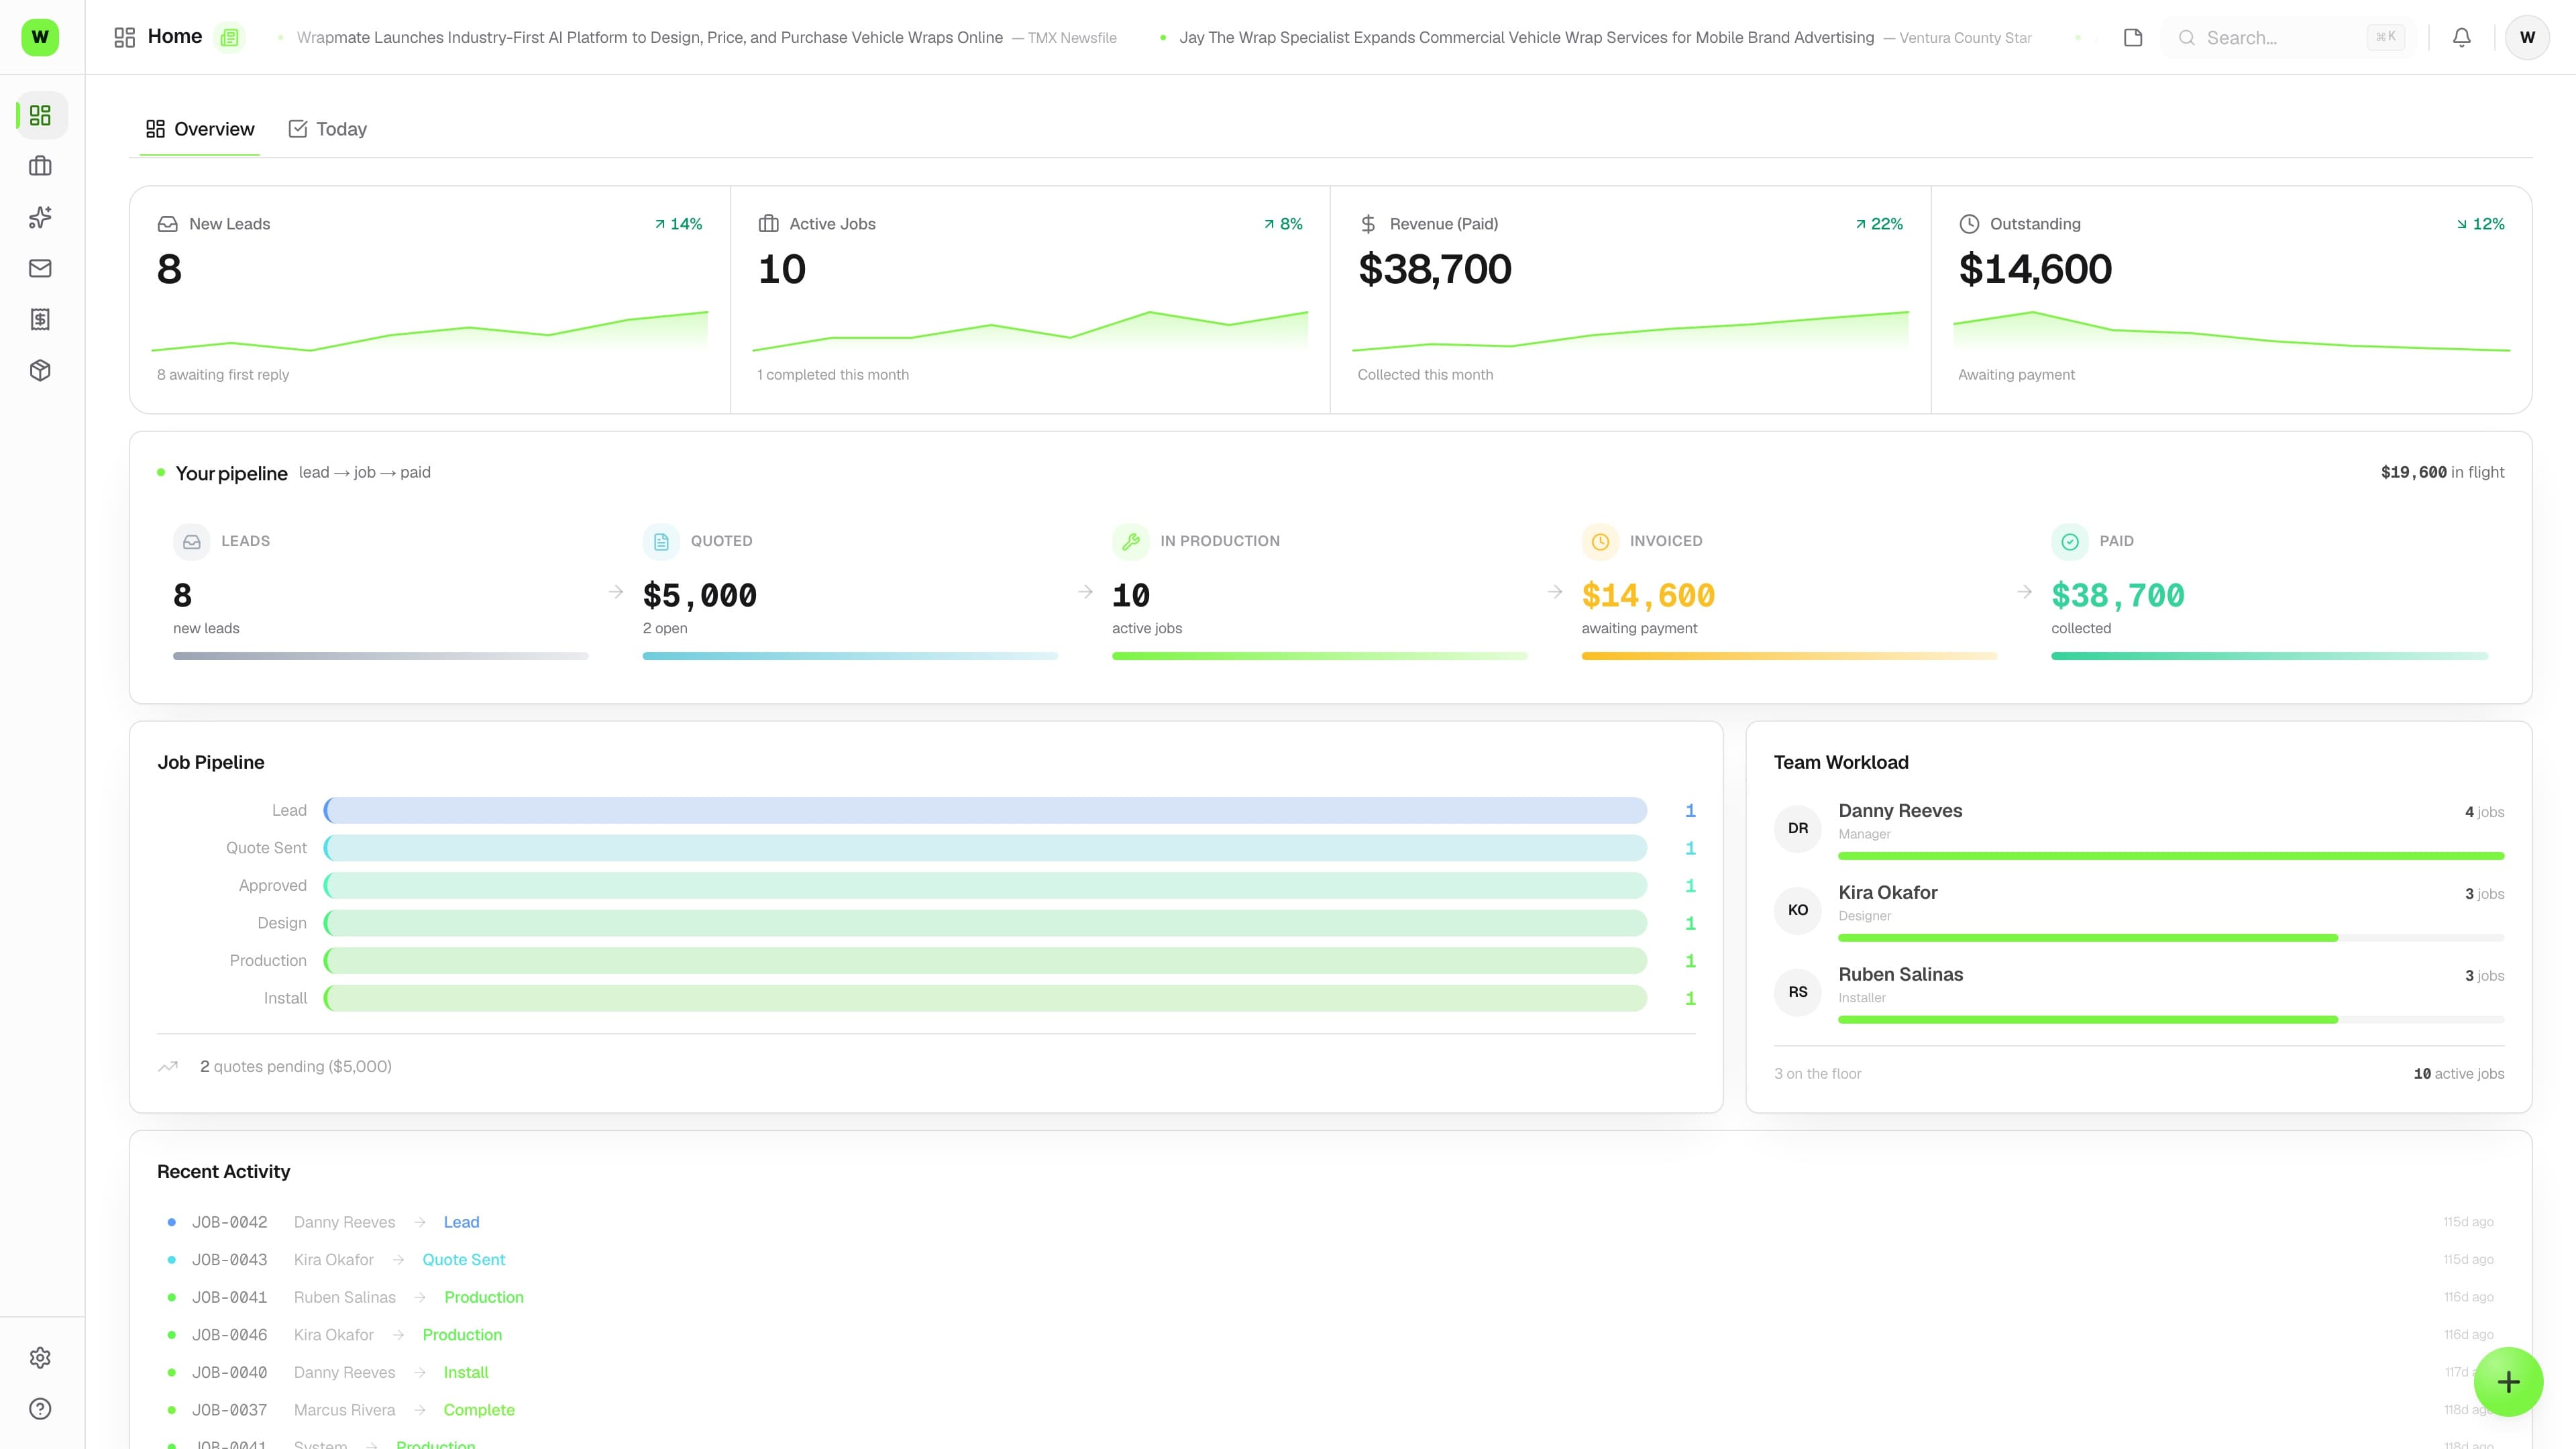
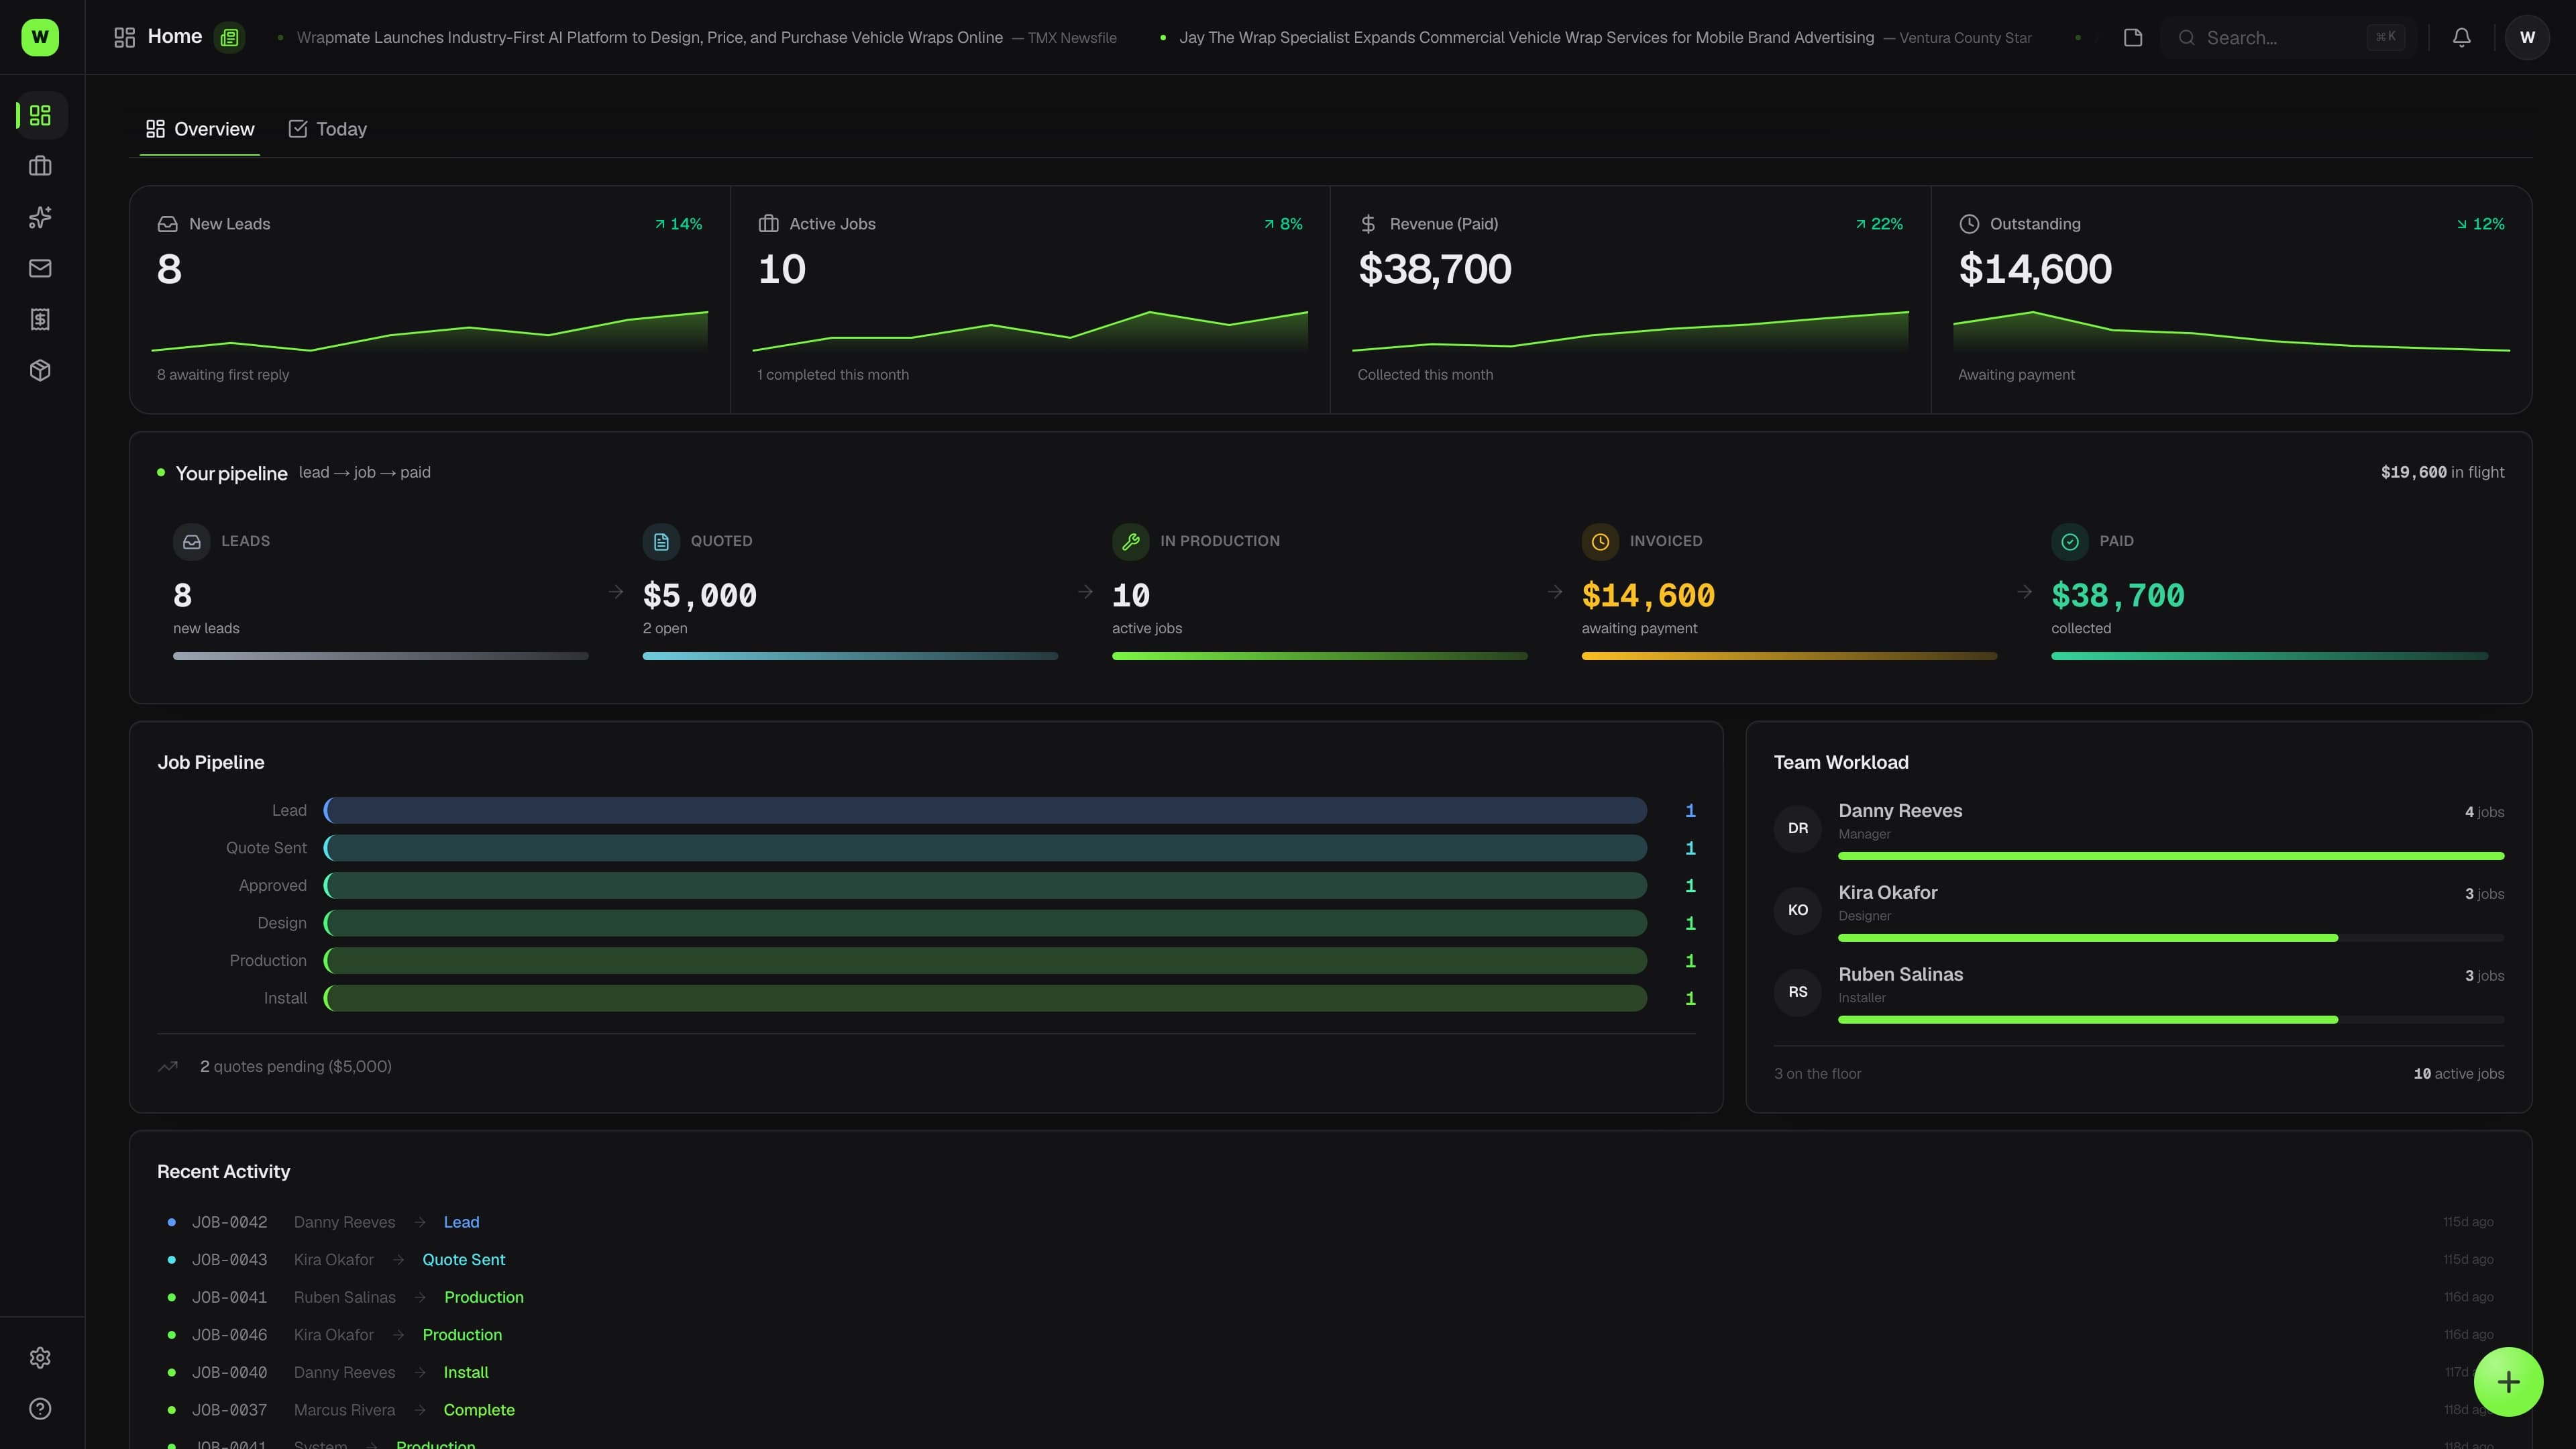
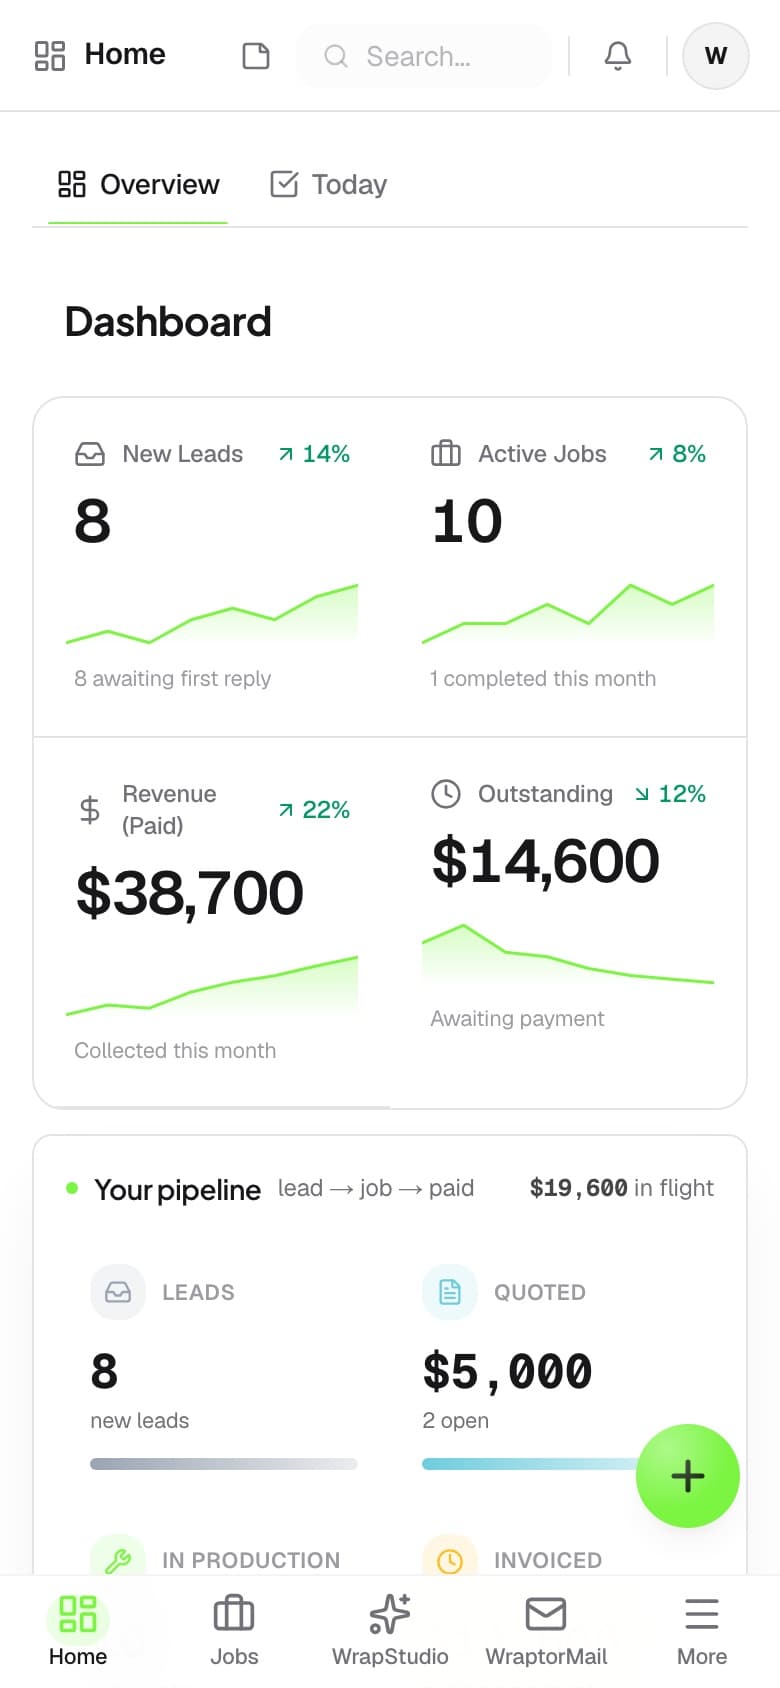
What is the Wraptor Dashboard?
The Dashboard is the manager's home screen — the first thing you see on sign-in. It's a live pulse monitor that pulls numbers from across Wraptor (jobs, quotes, invoices, team, and ink) into one screen, with four KPIs plus panels for the job and quote pipelines, team workload, low ink, and recent activity. It's read-only; everything links to where you'd make changes.
What does "Revenue (Paid)" mean on the Dashboard?
Revenue (Paid) sums invoices that have actually been paid — not approved quotes or sent-but-unpaid invoices. Quoted-but-unbilled value shows separately in the Quote Pipeline, and money still owed shows in the Outstanding tile, so each number reflects a different stage of cash.
Who sees the Dashboard?
The Dashboard is Manager-only. Managers are sent here on sign-in, while designers, production, and installers start on the Jobs board instead. To give a custom role the Dashboard, grant it the dashboard access plus Jobs and Inventory access, since it pulls in pipeline and low-ink data.
How is the Dashboard different from Reports?
The Dashboard answers "how are we doing right now?" with a live snapshot of active work, while Reports answers "what do the trends and the money look like over months?" The Dashboard is the lighter daily home screen; Reports is the deeper look back with month-over-month charts and the Profit Leak Detector.
Read your shop in ten seconds
The Dashboard is the manager's home screen on every Wraptor plan. Open it for a live snapshot of jobs, revenue, team load, and what needs attention today.
Try Wraptor